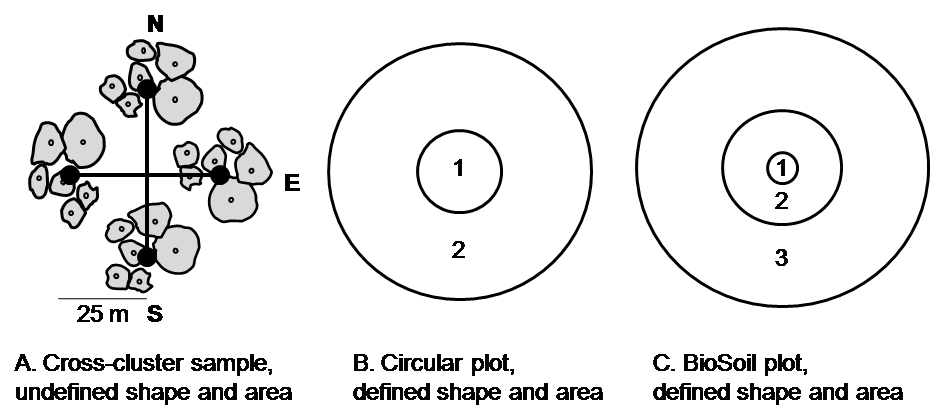
5 Plot design
Dictionary: d_plot_design
Examples of designs adopted for Level I plots in Europe (Drawing: M. Ferretti).
A. Cross-cluster
B. Circular
-
Subplot for all trees above given DBH thresholds
-
Subplot for large trees only
C. BioSoil plot
-
30 m² subplot
-
400 m² subplot
-
2000 m² subplot
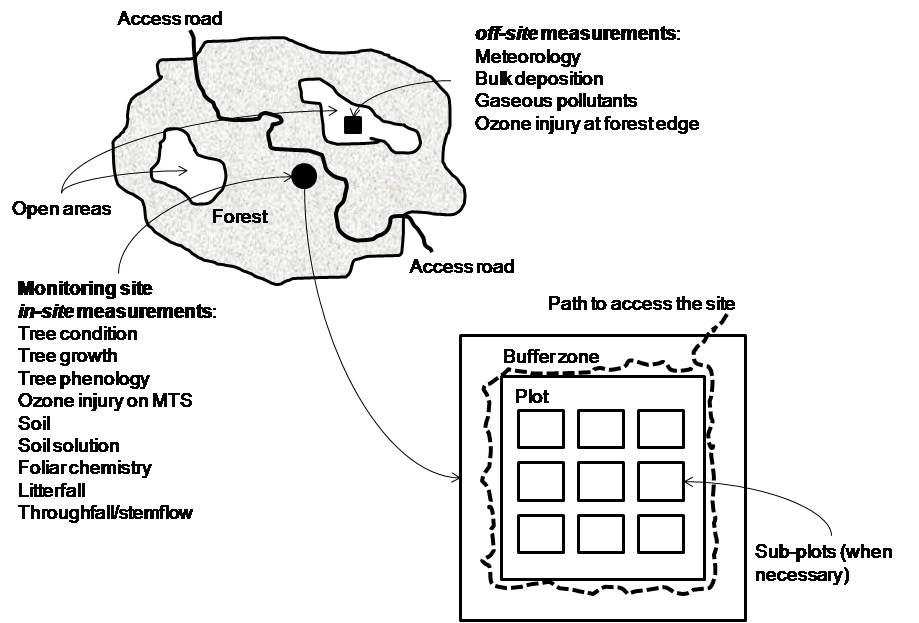
Example of location of a monitoring site and its possible organization, with buffer zone, plot and sub-plots (Drawing: M. Ferretti).
In-site measurements are those that must be carried out within the site.
Off-plot measurements are those to be carried out in an open area close to the plot.
Note that different shape (e.g rectangles, polygons) and size (min 0.25 ha) are possible, as well as different type of internal organization of the plot.
Size and shape must however be known and reported.